Support metrics are not isolated numbers. Each metric signals system behavior and must be interpreted in context.
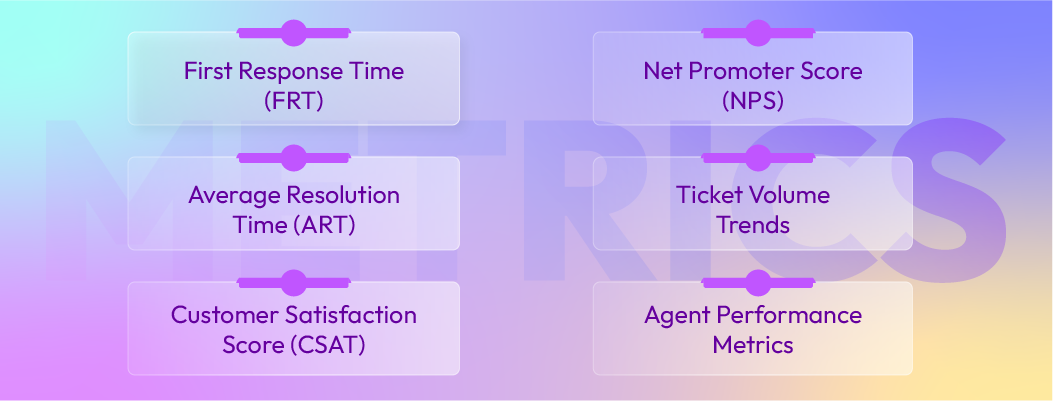
First Response Time (FRT)
First Response Time measures duration between ticket creation and first meaningful reply. It indicates acknowledgment speed and queue responsiveness.
FRT influences perception strongly. Long waits increase frustration even if final answers are correct. However, FRT alone does not measure quality. Automated acknowledgments artificially improve FRT without improving assistance.
FRT should be segmented by channel, priority, and time-of-day. A single average hides coverage gaps. FRT reflects responsiveness, not effectiveness.
Benchmark: Good: 2-4 hours. Excellent: under 1 hour. Premium support: under 15 minutes.
Average Resolution Time (ART)
Average Resolution Time measures total duration from ticket creation to closure. It reflects end-to-end throughput and operational efficiency.
Resolution time is more structurally meaningful than response time. It captures routing efficiency, knowledge access, and cross-team dependencies. Long resolution times often indicate unclear ownership, policy ambiguity, or product-level friction.
Resolution time should decompose into states: time in queue, time with agent, time waiting on customer, time waiting on internal teams. Without separation, managers misdiagnose causes.
Benchmark: Good: 24-48 hours. Excellent: under 24 hours. Premium: under 12 hours.
Customer Satisfaction Score (CSAT)
CSAT captures perceived service quality immediately after an interaction. It measures customer reaction, not operational mechanics.
CSAT becomes useful when segmented. A single average hides variance between issue types. Refund requests produce lower satisfaction than password resets. Escalations produce lower satisfaction than first-contact resolutions.
CSAT declines often correlate with repeated contact, unclear explanations, and inconsistent policy application. Satisfaction metrics require qualitative review of comments to identify root drivers.
Benchmark: Good: 80-90%. Excellent: 92%+.
Net Promoter Score (NPS)
Net Promoter Score measures overall loyalty at the account level. It is not support-specific but is influenced by service experience.
Support-related NPS declines appear when customers experience repeated friction across interactions rather than single incidents. Patterns of slow resolutions or unresolved issues reduce trust over time.
NPS should be interpreted cautiously within support analytics. It is a broader sentiment indicator, not an operational KPI.
Benchmark: Good: 30-50. Excellent: 70+.
Customer Effort Score (CES)
Customer Effort Score measures how difficult it was for customers to resolve their issue. It captures friction within the process.
High effort results from repeated information requests, channel switching, unclear documentation, or multiple transfers. These are workflow issues, not agent behavior issues.
CES is particularly useful for identifying structural friction. Reducing effort often improves satisfaction without changing response speed.
Benchmark: Good: 4.5-5 (on 7-point scale). Excellent: 6-7.
Ticket Volume Trends
Ticket volume measures demand entering the system. Volume alone does not indicate failure; it indicates load.
Operational value lies in segmentation. Volume should examine by contact reason, product area, and severity. A general increase may be normal growth. A spike in specific category may indicate product regression or policy confusion.
Volume trends support staffing decisions and capacity planning. They highlight opportunities for self-service or proactive communication.
Benchmark: Track baseline monthly volume and flag increases above 20% or decreases below -10%.
Agent Performance Metrics
Agent metrics measure consistency and workload handling. They should not be used as simplistic performance comparisons.
Useful measures: median response time, resolution rate by issue complexity, reopen rate, quality assurance scores. Comparing agents without adjusting for issue type leads to distorted conclusions.
Performance analysis focuses on training opportunities and workload balance. Variance often reflects systemic complexity, not individual weakness.


Leave a Comment
Your email address will not be published. Required fields are marked *
By submitting, you agree to receive helpful messages from Chatboq about your request. We do not sell data.