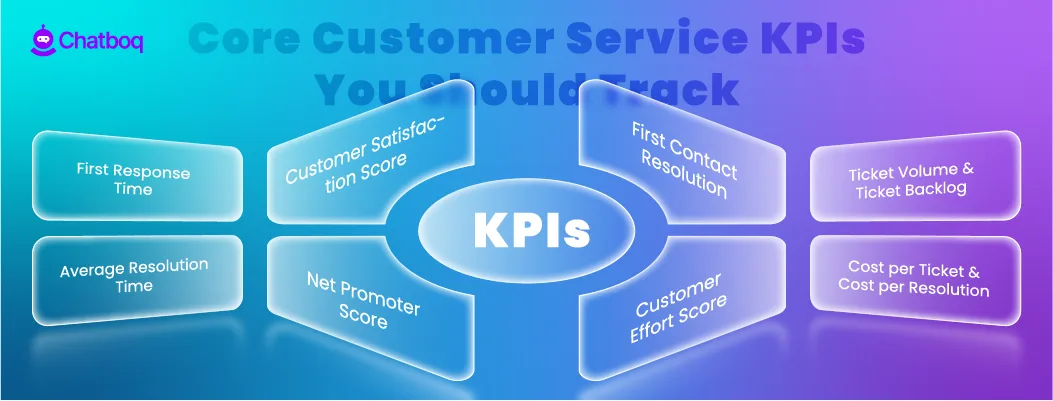
Below are the KPIs most teams track first. Each KPI includes what it means, how to calculate it, and what it tells you operationally.
First Response Time (FRT)
First Response Time measures how long it takes for a customer to receive the first meaningful reply after creating a ticket. It is one of the clearest indicators of whether customers feel supported quickly.
Formula:
First Response Time = first reply timestamp minus ticket creation timestamp
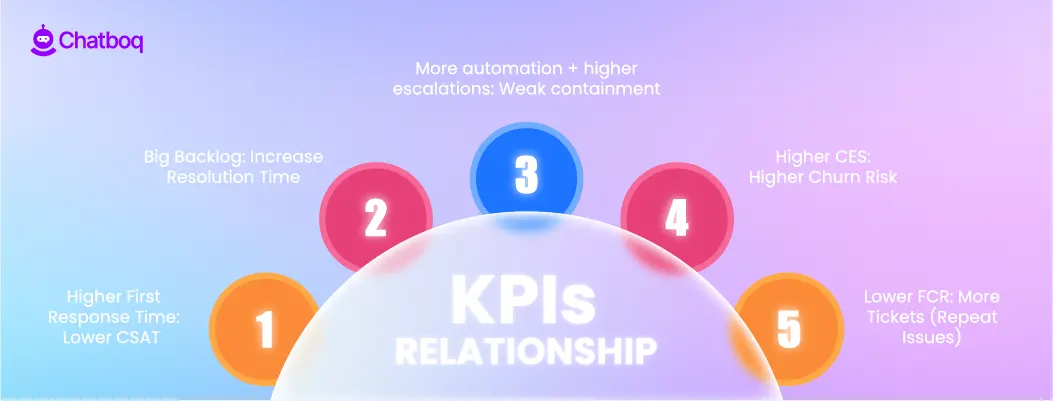
A rising First Response Time usually means one of three things: demand increased, staffing coverage is weak, or routing is not distributing tickets properly, which often becomes visible in structured call center reporting. If you only improve response time by rushing replies, CSAT often drops, so response targets should be paired with quality KPIs.
Average Resolution Time (ART)
Average Resolution Time measures how long it takes to fully resolve a ticket from start to finish. It reflects workflow speed, collaboration efficiency, and knowledge clarity.
Formula:
Average Resolution Time = total resolution time divided by number of resolved tickets
When resolution time increases, the cause is usually not “slow agents.” It is often unclear handoffs, repeated escalations, missing documentation, or product issues that create long back and forth loops. ART becomes much more useful when you segment it by issue category or channel.
Customer Satisfaction Score (CSAT)
CSAT measures short term satisfaction after a support interaction. It is usually collected through a short survey that asks customers to rate the help they received.
Formula:
CSAT = satisfied responses divided by total responses multiplied by 100
CSAT is powerful because it shows how customers perceive support quality even when speed looks good. A drop in CSAT often happens when responses become less clear, resolution steps are incomplete, or customers are transferred multiple times. CSAT improves most when you pair it with ticket review and coaching, supported by clearly defined CSAT KPIs.
Net Promoter Score (NPS)
NPS measures long term loyalty and whether a customer is likely to recommend the business. It is less about a single support interaction and more about ongoing trust.
Formula:
NPS = percentage of promoters minus percentage of detractors
NPS is useful when you want to connect service performance to retention, brand perception, and customer lifetime value. It becomes especially valuable when you compare NPS trends against CSAT and Customer Effort Score to see what is driving loyalty decline.
First Contact Resolution (FCR)
FCR measures how often customer issues are fully resolved in the first interaction without follow up. It is one of the best “efficiency plus quality” KPIs because it reduces repeat volume.
Formula:
FCR = first contact resolutions divided by total cases multiplied by 100
Low FCR usually increases ticket volume because customers come back with the same issue. It often indicates unclear troubleshooting paths, weak knowledge base coverage, or routing problems that send tickets to the wrong agent first.
Customer Effort Score (CES)
CES measures how easy it was for a customer to get their issue resolved. Even when resolution happens, high effort creates friction that reduces loyalty.
CES is often collected with a question like “How easy was it to resolve your issue?” Customers who report high effort are more likely to churn later, especially in subscription products.
CES improves when you reduce repeated verification steps, minimize transfers, simplify support paths, and make self service content easy to find.
Ticket Volume and Ticket Backlog
Ticket volume measures how many new requests arrive over a period. Backlog measures how many remain unresolved. These are operational KPIs because they explain queue pressure.
When volume rises without staffing changes, response time and SLA compliance usually decline. When backlog grows, resolution time increases and customers experience longer delays.
Backlog becomes more actionable when you track it by ticket age. A backlog of new tickets is different from a backlog of aging tickets that may signal process breakdown.
Cost per Ticket and Cost per Resolution
Cost per ticket measures the average operational cost per customer request. Cost per resolution measures the cost per fully solved case.
Formulas:
Cost per Ticket = total support cost divided by total tickets
Cost per Resolution = total support cost divided by total resolved cases
These KPIs matter when your team is scaling and leadership needs to see efficiency improvements. Cost improves when FCR rises, repeat contacts drop, and automation handles simple work without increasing escalations.


Leave a Comment
Your email address will not be published. Required fields are marked *
By submitting, you agree to receive helpful messages from Chatboq about your request. We do not sell data.