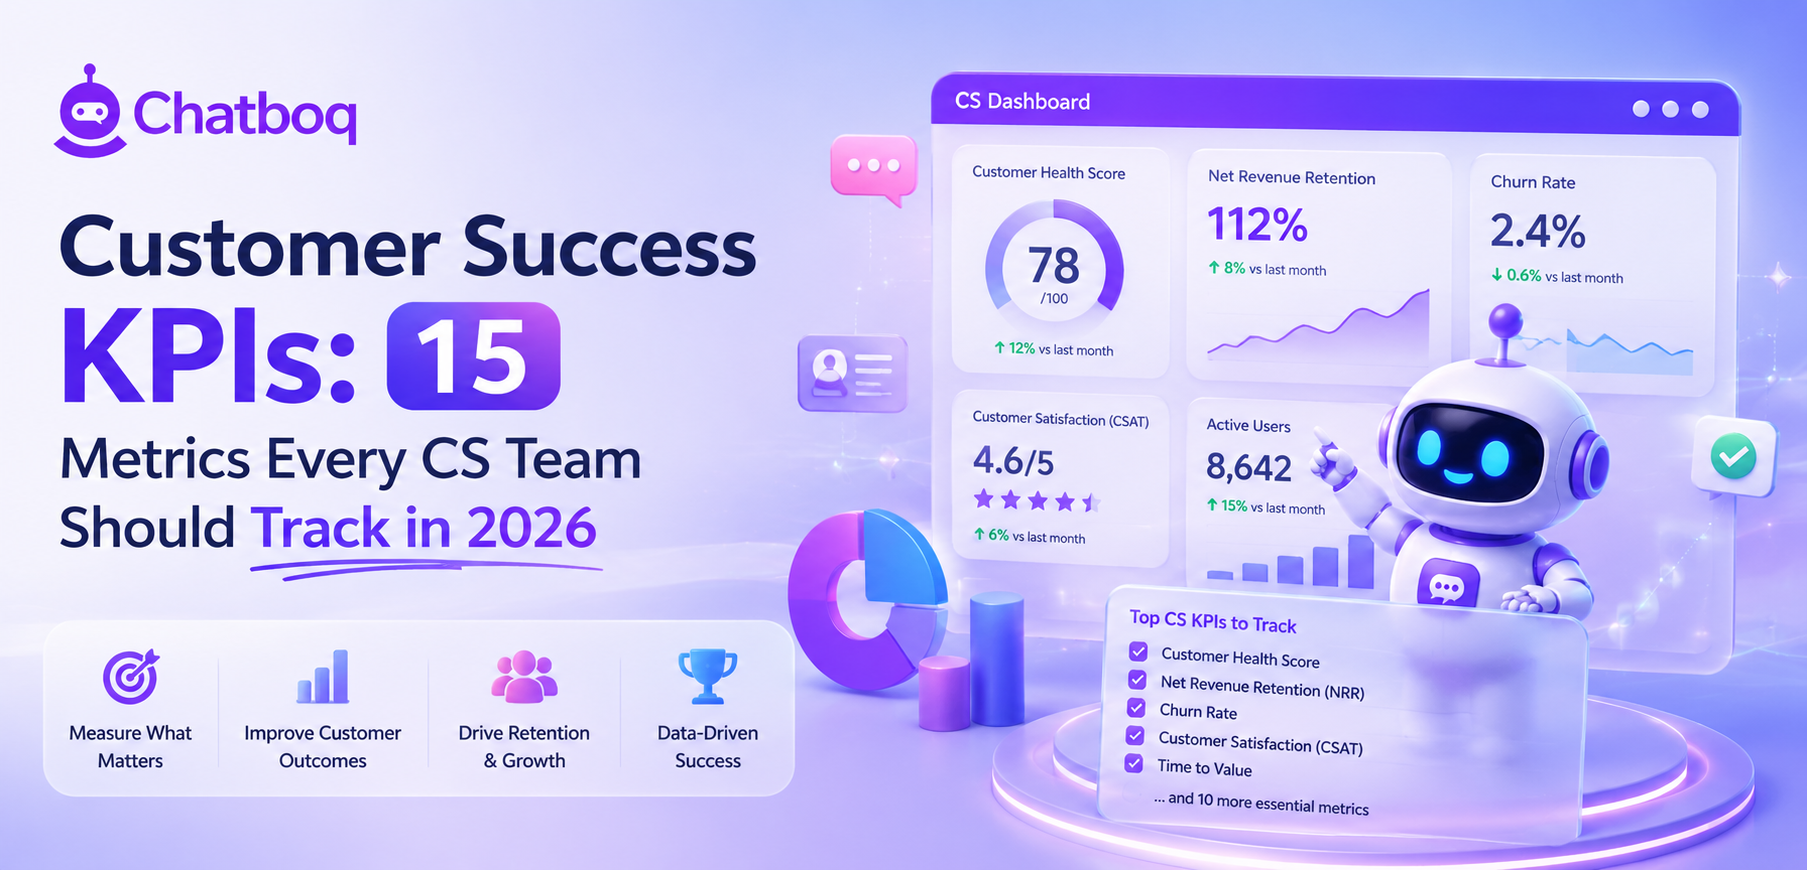
The most important customer success KPIs include NRR, GRR, churn rate, renewal rate, expansion revenue, CLV, customer health score, product adoption rate, TTV, NPS, CSAT, CES, FCR, onboarding completion rate, and support ticket trend per customer.
1. Net Revenue Retention (NRR)
What It Measures
NRR measures total revenue retained and expanded from existing customers over a period, including upsells and expansions but excluding new customer revenue entirely.
Formula
NRR = ((Starting MRR + Expansion - Contraction - Churn) / Starting MRR) x 100.
Good Benchmark
A good NRR for SaaS companies is generally 100% or higher, with best-in-class companies achieving 110% to 130%, indicating expansion revenue exceeds losses from churn and contraction.
How to Improve It
Improve NRR by prioritizing proactive expansion conversations with healthy accounts, identifying upsell-ready customers through usage data, and reducing contraction through stronger account management.
2. Gross Revenue Retention (GRR)
What It Measures
GRR measures revenue retained from existing customers excluding any expansion, capturing pure retention performance without upsell or cross-sell revenue masking churn.
Formula
GRR = ((Starting MRR - Contraction - Churn) / Starting MRR) x 100.
Good Benchmark
A good GRR is typically 90% or higher for healthy SaaS businesses, with GRR below 85% generally signaling a retention problem that expansion revenue cannot offset long-term.
How to Improve It
Improve GRR by addressing root causes of churn and contraction directly, since GRR cannot be improved through expansion tactics the way NRR can.
3. Customer Churn Rate
What It Measures
Churn rate measures the percentage of customers or revenue lost over a given period, the most direct indicator of whether the business is retaining its customer base.
Formula
Churn Rate = (Customers Lost During Period / Customers at Start of Period) x 100.
Good Benchmark
A healthy annual churn rate for SaaS is generally under 10% for SMB-focused products and under 5% for enterprise-focused products, given longer enterprise relationships and switching costs.
How to Improve It
Improve churn rate by identifying at-risk accounts earlier through health scoring, addressing onboarding gaps, and ensuring customers reach measurable value before renewal decisions.
4. Renewal Rate
What It Measures
Renewal rate measures the percentage of contracts or subscriptions renewed at the end of their term, a direct, forward-looking indicator distinct from churn measured after the fact.
Formula
Renewal Rate = (Number of Contracts Renewed / Number of Contracts Up for Renewal) x 100.
Good Benchmark
A healthy renewal rate is generally 85% to 95% or higher for established SaaS businesses, with rates below 80% typically indicating product or value realization problems.
How to Improve It
Improve renewal rate through structured renewal forecasting, early risk identification, and proactive outreach well before the actual renewal date arrives.
5. Expansion Revenue
What It Measures
Expansion revenue measures additional revenue generated from existing customers through upsells, cross-sells, or seat expansion, separate from new customer acquisition revenue.
Formula
Expansion Revenue = Total Additional Revenue From Existing Customers During Period (upsells + cross-sells + seat growth).
Good Benchmark
Best-in-class SaaS companies generate 20% to 30% of total revenue from expansion, indicating a healthy land-and-expand growth motion within the existing customer base.
How to Improve It
Improve expansion revenue by identifying usage patterns indicating readiness for additional seats or tiers, and structuring proactive expansion conversations into the CS workflow.
6. Customer Lifetime Value (CLV)
What It Measures
CLV measures the total revenue a business can expect from a customer over the entire duration of the relationship, informing how much can reasonably be spent on acquisition and retention.
Formula
CLV = Average Revenue Per Account x Average Customer Lifespan (or Average Revenue Per Account / Churn Rate).
Good Benchmark
A healthy CLV-to-CAC ratio is generally 3:1 or higher, indicating the business generates at least three times the revenue of what it costs to acquire a customer.
How to Improve It
Improve CLV by extending average customer lifespan through stronger retention practices and increasing average revenue per account through expansion.
7. Customer Health Score
What It Measures
Customer health score is a composite indicator combining usage, engagement, support history, and sentiment signals into a single score predicting churn or expansion likelihood.
Formula
Health Score = Weighted Sum of Component Signals (e.g., 30% product usage + 25% engagement + 20% support sentiment + 25% relationship strength), with weights customized per business.
Good Benchmark
There is no universal numeric benchmark, since health scoring is relative to each business's own model, but accounts should be segmented clearly into healthy, at-risk, and critical tiers for action.
How to Improve It
Improve health score accuracy by validating the model against actual churn outcomes over time, adjusting component weights as predictive accuracy data accumulates.
8. Product Adoption Rate
What It Measures
Product adoption rate measures the percentage of available features or core product capabilities a customer is actively using, indicating depth of product engagement beyond simple login activity.
Formula
Product Adoption Rate = (Number of Core Features Used / Total Core Features Available) x 100, often tracked per account or per user.
Good Benchmark
A healthy adoption rate varies by product complexity, but customers using fewer than 20% to 30% of core features generally carry meaningfully elevated churn risk.
How to Improve It
Improve adoption rate through targeted in-app guidance, proactive CSM outreach around underused high-value features, and onboarding sequences that introduce capability progressively over time.
9. Time to Value (TTV)
What It Measures
TTV measures the time between a customer's initial signup or contract start and the point they realize meaningful value from the product, a strong leading indicator of early churn risk.
Formula
TTV = Date of First Meaningful Value Achieved - Date of Signup or Contract Start.
Good Benchmark
A good TTV varies by product complexity, but reducing TTV to under 30 days for SaaS products is generally associated with measurably stronger early retention outcomes.
How to Improve It
Improve TTV by simplifying onboarding to the minimum steps needed to reach a defined value milestone, and removing friction in initial setup and configuration.
10. Net Promoter Score (NPS)
What It Measures
NPS measures customer willingness to recommend the product to others, based on a single 0 to 10 survey question, segmenting respondents into promoters, passives, and detractors.
Formula
NPS = % Promoters (score 9 to 10) - % Detractors (score 0 to 6).
Good Benchmark
An NPS above 0 is generally considered acceptable, above 30 is good, and above 50 to 70 is considered excellent, though benchmarks vary meaningfully by industry.
How to Improve It
Improve NPS by closing the feedback loop with detractors directly, addressing root causes surfaced in open-ended responses rather than only tracking the numeric score.
11. Customer Satisfaction Score (CSAT)
What It Measures
CSAT measures satisfaction with a specific interaction or experience, typically collected immediately after a support interaction or onboarding milestone, rather than the broader relationship NPS captures.
Formula
CSAT = (Number of Satisfied Responses / Total Responses) x 100, usually based on a 1 to 5 satisfaction scale.
Good Benchmark
A good CSAT score is generally 80% or higher, with scores below 70% typically signaling a specific process or interaction quality problem requiring investigation.
How to Improve It
Improve CSAT by analyzing low-scoring interactions for specific root causes, and addressing process or training gaps revealed by recurring patterns in dissatisfaction.
12. Customer Effort Score (CES)
What It Measures
CES measures how much effort a customer had to expend to resolve an issue or complete a task, based on research showing effort reduction predicts loyalty more reliably than satisfaction alone.
Formula
CES = Average Score on a Scale (typically 1 to 7) From the Question: "How easy was it to resolve your issue?"
Good Benchmark
A good CES score is generally above 5 on a 7-point scale, with lower scores indicating friction-heavy processes that increase churn risk even when satisfaction appears acceptable.
How to Improve It
Improve CES by simplifying support processes, reducing the number of steps or handoffs required to resolve common issues, and addressing self-service gaps.
13. First Contact Resolution (FCR)
What It Measures
FCR measures the percentage of customer issues resolved in a single interaction, without requiring follow-up contact or escalation, directly affecting both satisfaction and operational cost.
Formula
FCR = (Issues Resolved on First Contact / Total Issues) x 100.
Good Benchmark
A good FCR is generally 70% to 75% or higher, with rates below 60% typically indicating either knowledge gaps or insufficient first-line resolution authority.
How to Improve It
Improve FCR by expanding agent knowledge base access, improving diagnostic accuracy at intake, and increasing first-line resolution authority for common issue types.
14. Onboarding Completion Rate
What It Measures
Onboarding completion rate measures the percentage of new customers who complete all defined onboarding milestones, a direct leading indicator of early-stage churn risk.
Formula
Onboarding Completion Rate = (Customers Completing Full Onboarding / Total New Customers) x 100.
Good Benchmark
A healthy onboarding completion rate is generally 80% or higher, with rates below 60% typically signaling onboarding friction requiring redesign.
How to Improve It
Improve completion rate by simplifying the onboarding sequence, identifying and removing the specific steps where customers most frequently drop off.
15. Support Ticket Trend per Customer
What It Measures
Support ticket trend per customer measures the change in ticket volume for a given account over time, where a rising trend often signals frustration or product friction preceding churn.
Formula
Support Ticket Trend = Current Period Ticket Volume - Prior Period Ticket Volume, tracked per account over rolling periods.
Good Benchmark
There is no universal numeric benchmark, but a sustained upward trend for an individual account, independent of overall company growth, should trigger proactive CSM review.
How to Improve It
Improve this metric by investigating root causes behind ticket spikes per account, addressing recurring product or process issues rather than only resolving individual tickets.

 ChatGPT
 Perplexity
 Claude




Leave a Comment
Your email address will not be published. Required fields are marked *
By submitting, you agree to receive helpful messages from Chatboq about your request. We do not sell data.