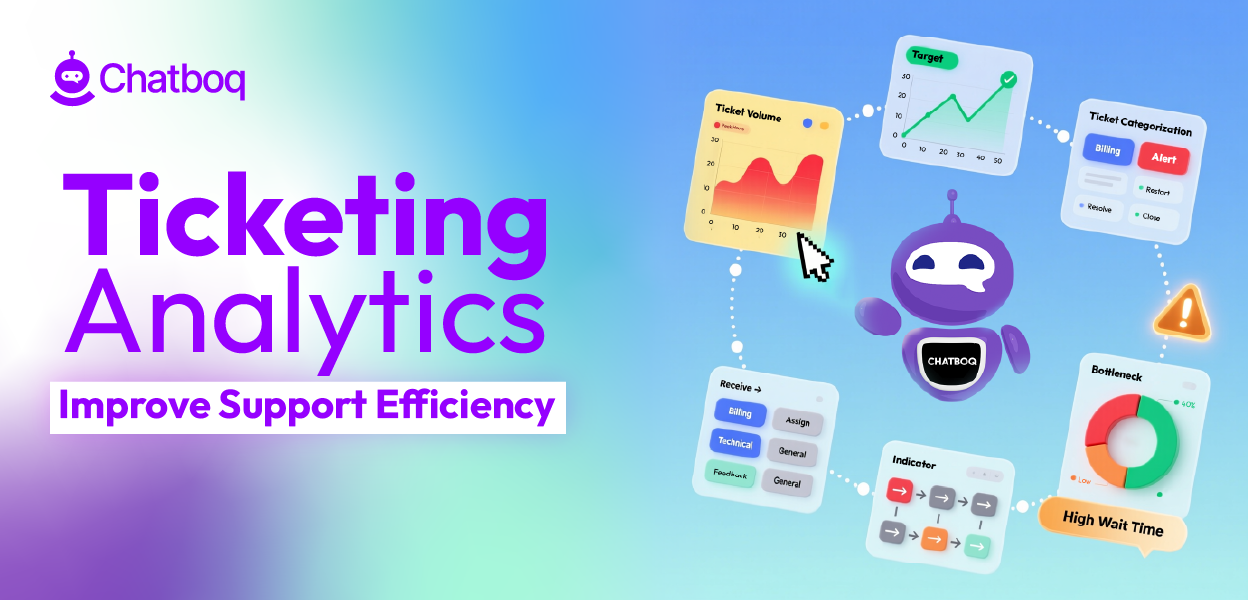
Ticketing analytics improves support efficiency by connecting metrics to execution. Data alone does not improve performance. Improvement requires clear signals followed by controlled adjustments inside the workflow.
The impact becomes visible when you look at how analytics changes daily operations:
It balances workload across agents
Queue volume and agent utilization show whether work is evenly distributed. Without visibility, some agents may handle 40 tickets while others manage 15. This imbalance increases response time and error risk. Over time, overloaded agents burn out and SLA performance becomes unstable.
For example, if one queue receives 60% of incoming tickets but only 30% of agents are assigned to it, first response time will begin to drift within days. The issue is routing structure, not agent ability.
What to do:
-
Monitor tickets per agent daily instead of only reviewing weekly summaries.
-
Set maximum ticket thresholds per shift to prevent overload.
-
Use skill-based routing where ticket complexity matches agent expertise.
-
Review queue distribution weekly and rebalance before backlog grows.
What happens if ignored:
-
High performers absorb excess work and leave.
-
SLA compliance drops during peak volume.
-
Resolution quality becomes inconsistent across shifts.
Workload control is the first layer of support efficiency, and it becomes easier to manage when you operationalize a support performance dashboard that keeps backlog, workload, and SLA risk visible.
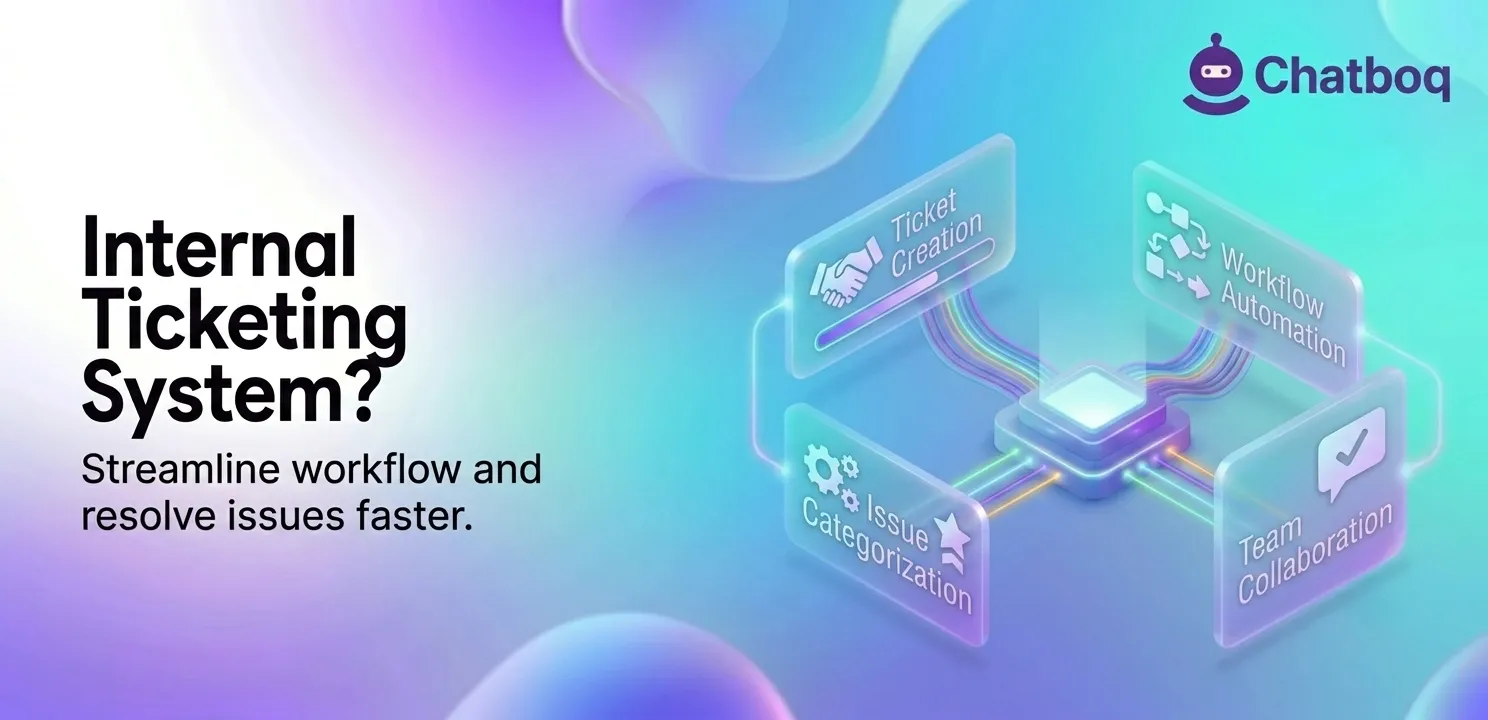
It detects bottlenecks inside the workflow
Resolution time increases when tickets stall at specific stages. These delays often occur in approval steps, unclear ownership transitions, or repeated escalations between tiers. Without breakdown analysis, teams assume agents are slow. In many cases, the process design causes delay.
For example, if tickets spend eight hours in “Waiting for Internal Approval” but only thirty minutes in active handling, the bottleneck is approval design. Hiring more agents will not solve that delay.
Customer support analytics breaks resolution time into workflow segments. This reveals where friction accumulates.
What to do:
-
Track time spent in each workflow stage, not only total resolution time.
-
Audit escalation loops to prevent ticket bouncing.
-
Standardize handoff rules so ownership is always clear.
-
Remove approval layers that do not reduce measurable risk.
What happens if ignored:
-
Resolution time grows slowly but steadily.
-
Teams increase headcount without fixing structural issues.
-
Escalation rates rise because tickets lack clear ownership.
Efficiency improves when routing rules, approval layers, and ownership boundaries are corrected at the source.
It protects SLA performance through early risk detection
SLA compliance declines when aging tickets remain unnoticed. Basic helpdesk reporting shows missed targets after breach occurs. At that point, recovery requires manual escalation and reactive intervention.
Predictive analytics identifies high-risk or delayed tickets before breach.
For example, if a ticket has one hour left before SLA and no agent activity in two hours, the system should trigger intervention automatically. That prevents breach instead of reacting to it.
What to do:
-
Flag tickets approaching SLA thresholds automatically.
-
Trigger escalation at defined risk intervals.
-
Review breach patterns weekly to detect recurring causes.
-
Align SLA targets with real staffing capacity.
What happens if ignored:
-
SLA compliance becomes unstable.
-
End-of-day escalations increase.
-
Customer trust declines due to inconsistent response times.
AI dashboards improve ticket resolution speed by surfacing at-risk tickets early. Early intervention stabilizes service quality through real-time reporting and operational visibility before breach happens.
It reduces repeat work and hidden inefficiency
Reopen rate shows whether issues are fully resolved. A high reopen rate increases cost per ticket and reduces customer satisfaction. Repeat tickets often signal unclear documentation or automation closing tickets too early.
For example, if password reset tickets reopen 25% of the time, the issue may be incomplete instructions or premature closure rules. The problem is process clarity, not customer behavior.
What to do:
-
Track reopen rate by category.
-
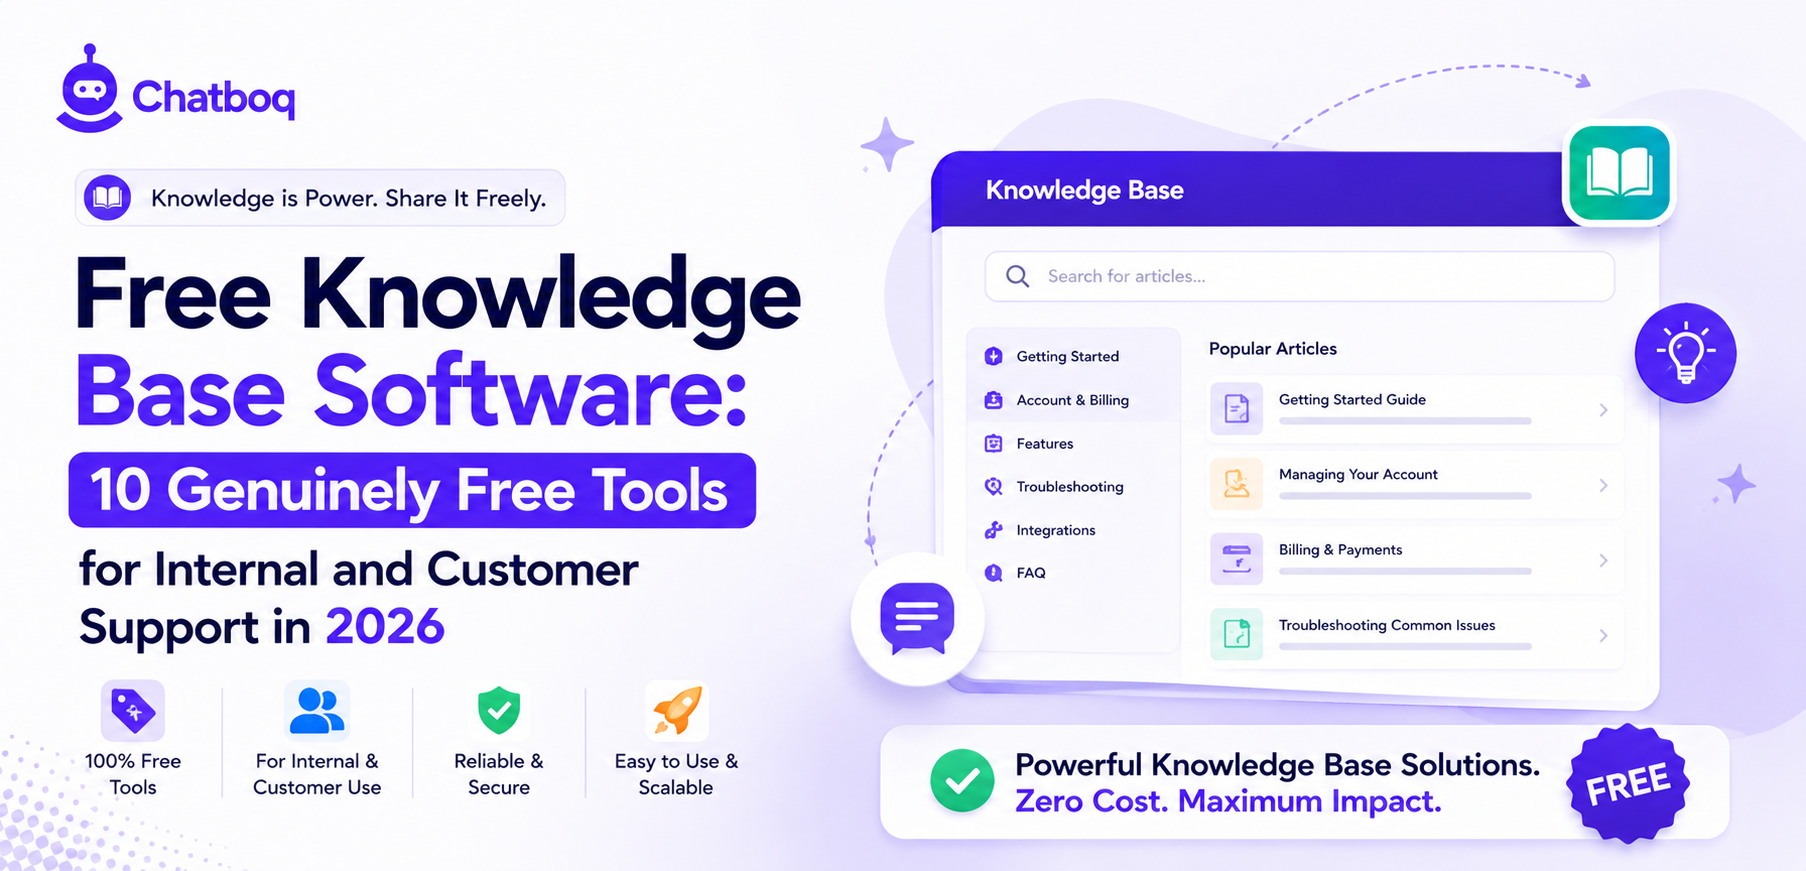
Update knowledge base articles for high-repeat issues.
-
Review automation rules that close tickets automatically.
-
Require structured resolution notes for complex cases.
What happens if ignored:
-
Agents solve the same issue repeatedly.
-
Ticket volume appears stable but hidden cost increases.
-
Customer satisfaction declines due to repeated contact.
Ticketing analytics reduces operational costs by eliminating repeated effort.
It improves prioritization using business context
Not all tickets have equal operational impact. Some affect revenue accounts. Some affect churn risk. Some affect system-wide issues.
CRM integration centralizes customer data inside the ticket view. AI analytics uses that data to prioritize tickets based on impact, not arrival order.
For example, a billing issue from a high-value account should not wait behind a low-impact general inquiry.
What to do:
-
Define priority tiers linked to account value and impact.
-
Integrate CRM data into the ticket management system.
-
Surface repeat high-risk accounts automatically.
-
Separate emotional urgency from operational urgency.
What happens if ignored:
-
High-value customers wait unnecessarily.
-
Agents rely on manual judgment under stress.
-
Escalations increase due to misprioritization.
Ticketing analytics supports ROI and customer retention by aligning effort with business impact, using customer analytics framework signals to prioritize tickets by risk and value.
It connects operations to measurable outcomes
Efficiency is not only speed. It is stability and cost control. Stabilized first response time strengthens customer satisfaction. Stable backlog reduces escalation load.
Lower reopen rates decrease cost per ticket.
Customer support analytics connects daily ticket execution to measurable business results such as cost per ticket and renewal stability. Modern ticketing systems such as Zendesk, HubSpot, and Chatboq provide real-time dashboards, but analytical depth determines how effectively risk patterns and workflow behavior are detected. Chatboq provides AI dashboards and predictive analytics designed to detect operational risk patterns early, which prevents performance decline instead of reacting to it.


Leave a Comment
Your email address will not be published. Required fields are marked *
By submitting, you agree to receive helpful messages from Chatboq about your request. We do not sell data.